Access the full white paper report
Despite trailing in most national public opinion polls, President Donald Trump regularly refers to a “silent majority” of Americans who he expects to vote for him on Election Day. But how many voters are reluctant to publicly share their opinion about the president?
Building on our 2015 and 2016 research, Morning Consult recently conducted a study of more than 2,400 likely voters to determine if the “shy Trump” voter phenomenon is affecting polling in the 2020 election. The study also examined whether social desirability bias is at play on a range of topics that have been particularly prevalent this year.
To conduct the study, all survey respondents answered a set of demographic questions online and then were randomly assigned to answer a brief, identical set of questions about politics and society either online or via a live telephone interview. By comparing these live telephone interviews with online responses, we were able to identify where social desirability bias was in effect.
There was clear evidence that voters are hesitant to express their opinions on discrimination, protests and personal finances during a live telephone interview. And while there is no indication that “shy voters” are affecting the overall national popular vote to a statistically significant degree, nuances in the data leave open the possibility that there could be effects at the margins for both Trump and Biden.
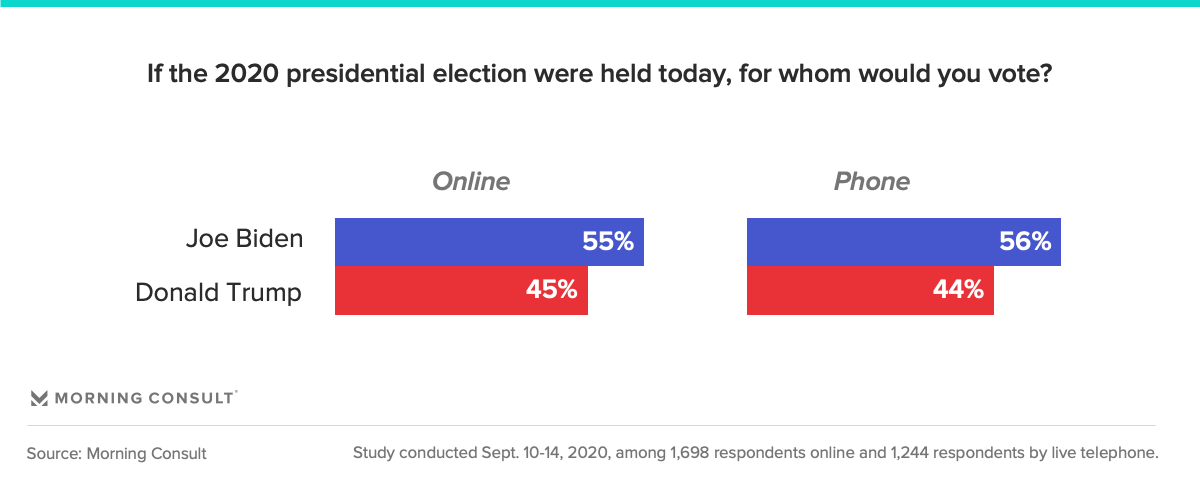
Among all likely voters, Joe Biden and Donald Trump receive a similar level of support online and via phone. Biden received 55 percent support to Trump’s 45 percent support among those who took the survey online and Biden received 56 percent support to Trump’s 44 percent among phone respondents.
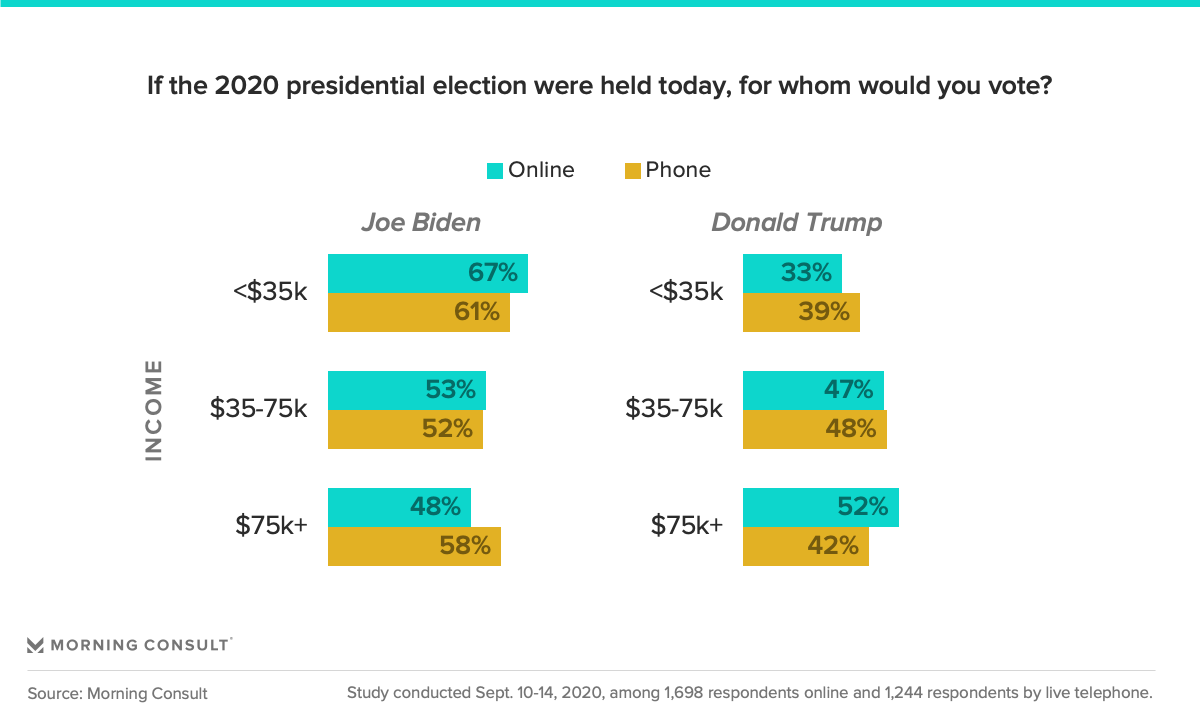
In our prior studies, we observed that differences between phone and online are larger among adults with higher levels of formal education and those with higher incomes. On education, we find limited evidence for this in the 2020 race. Among income levels, there is evidence of a mode effect. Trump receives lower support on the phone than online among those making $75,000 or more each year, whereas Biden receives lower support on the phone than online among households earning less than $35,000 annually.
However, differences between income groups did not reach statistical significance. When taken together, differences between subgroups did not change the overall finding that President Donald Trump lagged behind Joe Biden by 10 percentage points in both online and phone interviews.
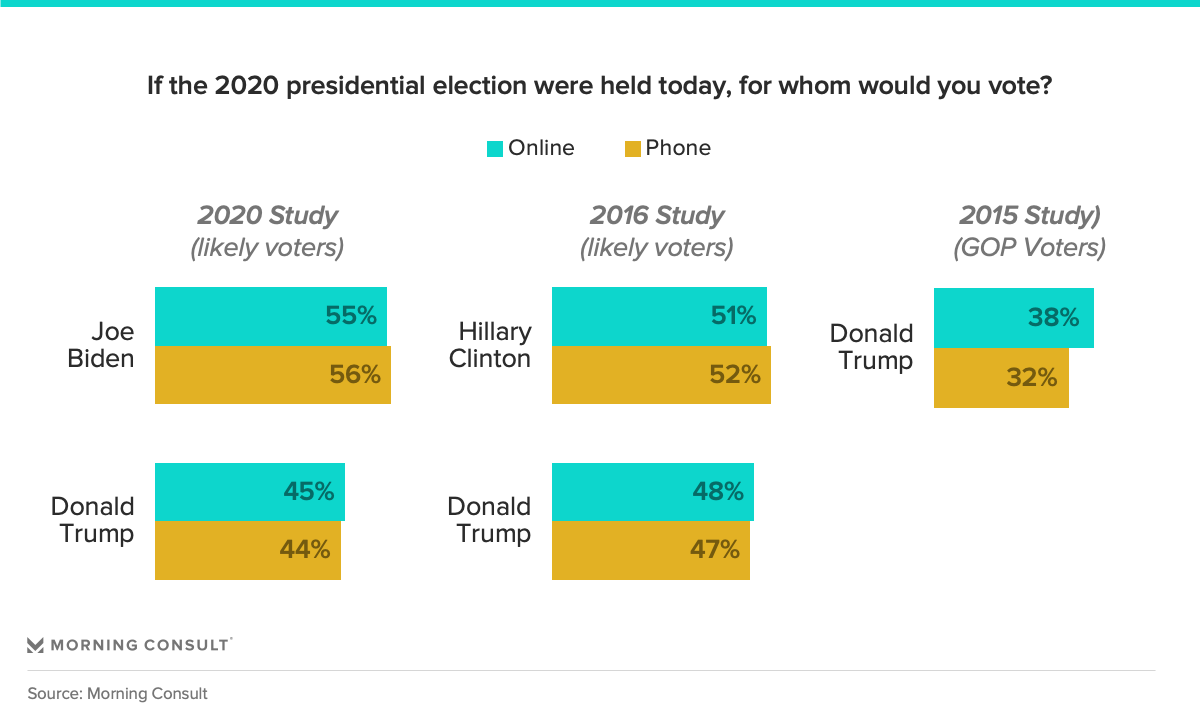
When we first explored the “shy Trump” voter hypothesis in 2015, we found that Republican primary voters were 6 percentage points less likely to say they supported Donald Trump when interviewed on the phone compared with online. By 2016, when Trump was the Republican presidential nominee, that effect had vanished among registered voters.
The study also examined whether social desirability bias is at play on a range of sensitive topics that have been particularly prevalent this year.
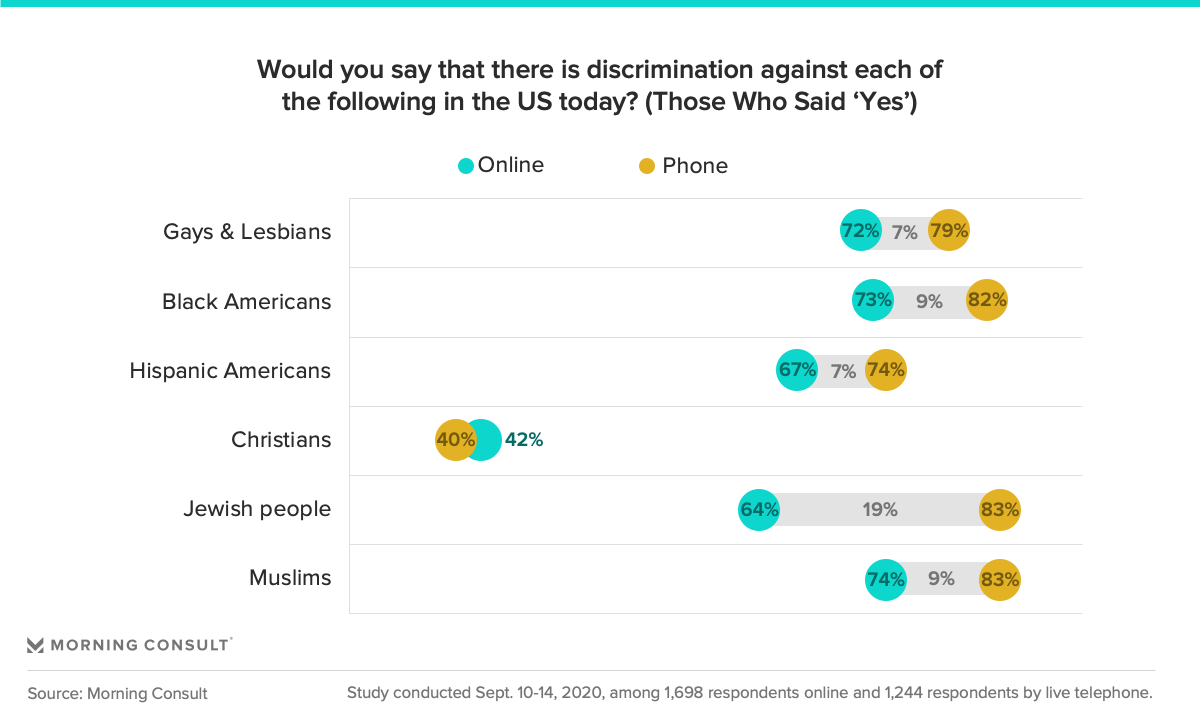
Morning Consult asked respondents whether they believed there was discrimination in the U.S. today against a range of races, religions and sexual orientations. There was a social desirability bias present in these questions, with voters much more likely to say there is discrimination against these groups when they answer on the phone than when they answer online.
Phone respondents were more likely to say there is more discrimination against Black Americans, gays and lesbians, Hispanics, Muslims and Jewish people. Christians were the only group with no statistically significant difference between phone and online responses.
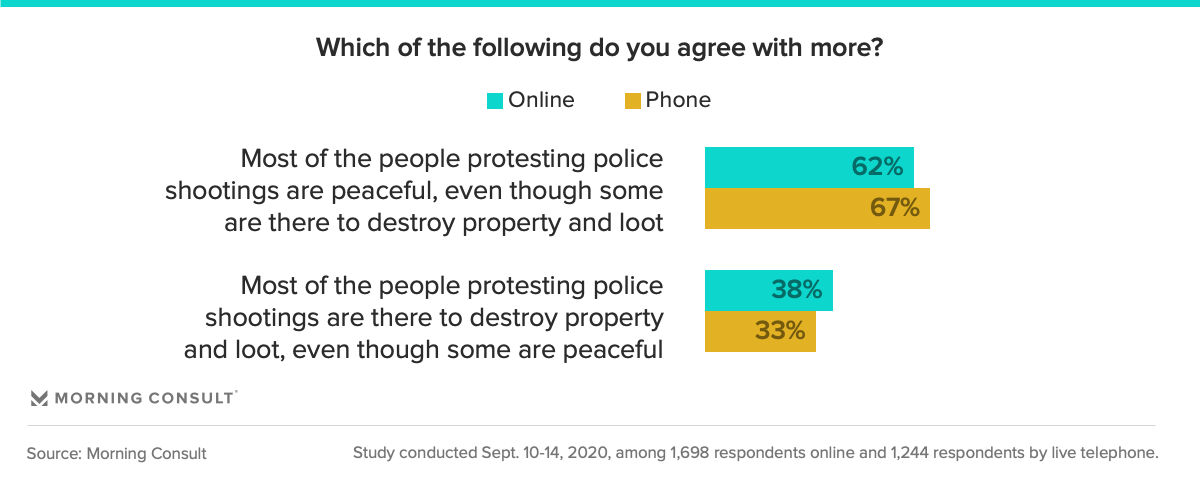
Protests and demonstrations have occurred in hundreds of cities across the country in 2020 in the aftermath of the May 25 police killing of George Floyd. Voters are more likely to say the protesters are peaceful on the phone and more likely to say they are violent when they answer online.
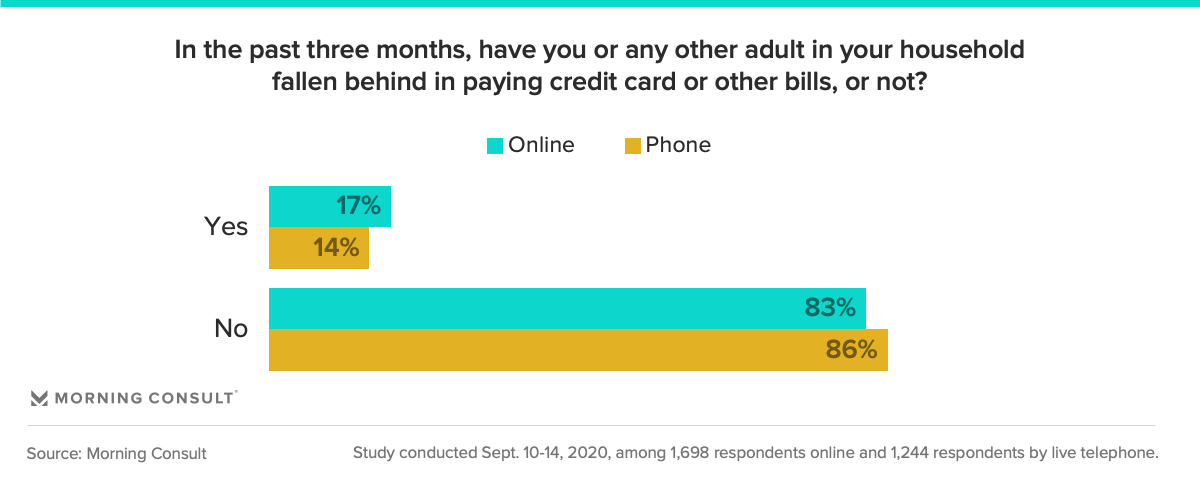
Finally, with the economy hit hard by the COVID-19 pandemic, we wanted to gauge whether voters were reluctant to share their personal finance situation with a live telephone interviewer. When asked if they had trouble paying their bills, voters were 3 points less likely to say they have had trouble on the phone than online.
Morning Consult recruited respondents to a national online survey of registered voters.1 All voters answered a set of demographic questions online and then were randomly assigned to answer a brief, identical set of questions about politics and society either online or via a live telephone interview.
Voters in the telephone condition viewed a page with brief instructions to click on a button to make a free call from their computer, mobile phone or tablet. They were also given the option of dialing a toll-free number, an approach we used in prior studies conducted in 2015 and 2016. Voters were transferred to an inbound call center with live interviewers on staff 24 hours a day, seven days a week.2 Voters in the online condition continued to the next page of the online survey.
Both groups — online and phone — then completed an identical set of 13 questions, including 2020 presidential vote choice and a series of socially sensitive topics that we expected may elicit different responses between online or phone interviews. Specifically, we asked voters about the level of discrimination against gay and lesbian people; Hispanic and Black Americans; Jewish, Muslim and Christian people; whether respondents go out of their way to buy American-made products, whether they have had difficulties paying credit card or other bills lately; whether most people protesting police shootings are peaceful or there to destroy property or loot; and whether respondents regularly feel resentful, exhibit jealously or admit mistakes. Prior studies have shown adults answer some of these questions differently across settings, and a number of questions form part of a key social desirability scale.
The study was conducted September 10-14, 2020 among 2,642 registered voters and 2,422 likely voters. Roughly equal numbers of participants completed the survey online (n = 1,398) or via live telephone interview (n = 1,244). The data were weighted to approximate a target sample of likely voters based on age, education, race/ethnicity, gender, geographic region, marital status, 2016 presidential vote history, the interaction of gender and age and the interaction of race/ethnicity and education. The margin of error for both the phone and online surveys is +/- 3 percentage points.