The past 90 days have been a masterclass in why lagging indicators aren't enough.
Between a historic drop in high-income consumer sentiment, a Supreme Court ruling that reshuffled tariff policy, and the start of military operations in Iran, the economic landscape has shifted multiple times in a single quarter. By the time most companies see these shifts reflected in their sales data, the window to respond has already closed.
At Morning Consult, we track these signals across tens of thousands of daily surveys. These are the five indicators we come back to every time the economic picture shifts -- and the ones we think every business leader should have on their radar.
A note on segmentation: throughout this piece, we use income as an illustrative example. But the same analytical tools can be applied to whatever segment defines your core customer base -- geography, generation, brand affinity, or any custom audience.
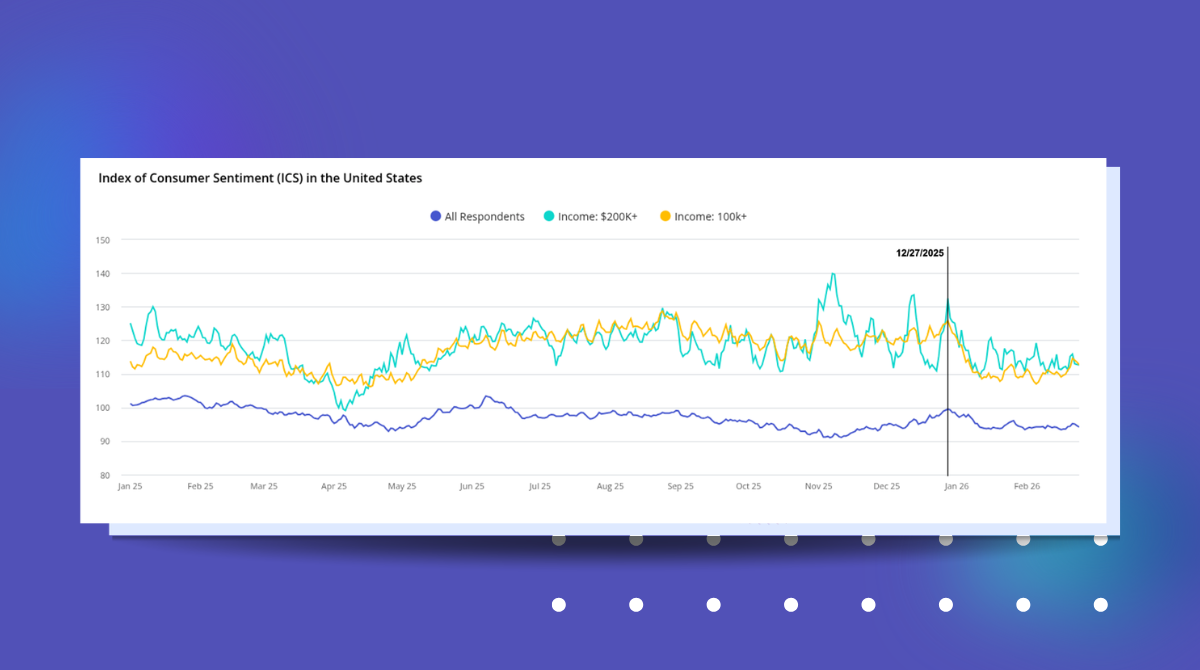
1. Consumer Sentiment (ICS): The Daily Read on Customer Confidence
What it is: Morning Consult's Index of Consumer Sentiment measures how consumers feel about their personal finances, the broader economy, and current buying conditions. We track it daily, segmented by income, geography, or any custom audience segment.
Why it matters for your business: The national headline number masks enormous variation across customer segments. If your customers skew high-income, urban, or toward a specific demographic, the national ICS might tell you everything is fine while your core customer base is pulling back. The reverse is also true. The graph below shows a recent example of how dramatically the segments can diverge.

What to watch: Divergence between your customer segment and the national number. When they move in opposite directions, the aggregate becomes actively misleading.
2. Pay Loss Rate: The Labor Market Signal That Moves First
What it is: Every week, Morning Consult asks 10,000 people a simple question: did you lose pay or income in the prior week? It captures hours cut, furloughs, and layoffs faster than government data like unemployment insurance claims, which require people to file.
Why it matters for your business: Pay loss is a leading indicator of spending pullback. When your customers start losing income, their purchasing behavior changes within weeks, long before it shows up in unemployment statistics or your quarterly sales reports.

What to watch: Movement across income segments. Pay loss historically starts as a lower-income story, but when it spreads to high-income adults, it signals a more widespread spending pullback is coming. The direction of that spread, and how quickly it moves, is the signal.
3. Consumer Health Index (CHI): The Consumer Spending Signal
What it is: Morning Consult's Consumer Health Index combines sentiment data (fast-moving, measures how consumers feel about spending) with labor market data (slower-moving, measures their actual capacity to spend). It's benchmarked to track annual spending growth in government data.
Why it matters for your business: Sentiment and employment don't always move together. Someone can feel nervous but still have a job. Someone can lose hours but still feel optimistic. The CHI brings both dimensions together into a single signal that's more predictive of actual spending behavior than either one alone.

What to watch: Whether sentiment and labor market data are moving in the same direction or diverging. When high-income consumers feel nervous but still have jobs, spending holds. When pay loss starts rising alongside sentiment decline, the CHI captures that convergence before it shows up anywhere else. That's when the data is telling you something your sales numbers aren't yet.
4. Price Sensitivity: Are Your Customers Walking Away?
What it is: Morning Consult's Price Sensitivity Index tracks how willing consumers are to walk away from a purchase because the price was higher than expected. We track it across 20+ categories - from groceries to autos to apparel - and we measure both the share of consumers encountering higher-than-expected prices ("price surprise") and whether they buy anyway or walk away.
Why it matters for your business: This tells you whether you have pricing power or not. A consumer who encounters a higher price and buys anyway is different from one who encounters a higher price and leaves. When the walk-away rate spikes, it means your customers are actively making trade-offs, and your brand might be on the losing side of that calculation. The graph below shows how price friction has moved across income segments over time.

What to watch: Whether price friction continues to spread evenly across income groups, or whether high-income consumers start diverging again. When a spike in price sensitivity is broad-based across categories and doesn't coincide with actual price increases, it signals a psychological shift rather than a financial one -- consumers choosing to be more careful, not being forced to. That behavioral change tends to be stickier than one driven purely by financial pressure. The crowding-out effect is also worth monitoring: consumers who absorb unavoidable price increases in essentials tend to pull back on discretionary spending even when their overall finances are healthy.
5. Financial Obligations & Savings Buffer: How Long Can They Hold?
What it is: Every month, Morning Consult tracks consumers' income sources, debt types, and the ratio between them (the Financial Obligations Ratio). We also track savings capacity - the share of consumers who have money left over each month after basic expenses. Together, these paint a picture of how much runway consumers have before economic stress changes their behavior.
Why it matters for your business: Even when sentiment drops and price sensitivity rises, consumers with strong balance sheets can sustain spending longer. This indicator tells you how long the buffer lasts - and when it starts to erode.
What to watch: The Financial Obligations Ratio for your core customer segment. If it starts ticking up, meaning debt is growing relative to income, that's an early warning the buffer is being drawn down. Financial resilience doesn't mean immunity. It means a longer runway. The question isn't whether consumers can absorb one shock. It's how many they can absorb simultaneously.
The Bottom Line
These five indicators tell a story that no single data point can capture on its own. Consumer sentiment tells you how people feel. Pay loss tells you what's happening to their income. The Consumer Health Index tells you whether they'll actually spend. Price sensitivity tells you whether they're choosing to pull back. And the financial buffer tells you how long they can hold.
Right now, the story is: consumers are nervous, especially at the top of the income spectrum, but they're not yet broken. The SCOTUS tariff ruling provided some relief. Balance sheets are still healthy. But the labor market is softening, price sensitivity is elevated, and the geopolitical environment adds another layer of uncertainty.
For business leaders, the actionable takeaway is this: don't wait for your sales numbers to tell you something has changed. By the time a shift in consumer financial health shows up in your quarterly results, it started weeks or months earlier, in the data we track every day.
This analysis is based on data as of March 6, 2026. Interested in learning more, receive weekly updates on the state of the economy from Morning Consult’s Chief Economist.
High-Income Consumer Confidence Is Cracking. Luxury Brands Are Next.

The New Pricing Imperative: Clear Insights in a Turbulent World
.png)