
Net Promoter Score is one of the most familiar advocacy metrics in business.
In 2018, 50 S&P 500 companies cited NPS more than 150 times on earnings calls, more than four times as many mentions as five years earlier, according to a Wall Street Journal analysis. Delta's CEO told investors in January 2026, "We have the number one Net Promoter Score among major airlines." T-Mobile's CEO cited "an industry-leading 45" on NPS the same year.
Yet a standalone NPS leaves executives without answers to three questions: Where do we stand, and against whom? Does advocacy relate to business outcomes? What can we do to improve it?
What's missing in traditional NPS
Fred Reichheld introduced NPS in 2003: the share of customers who rate a company 9 or 10 on likelihood to recommend, minus the share who rate it 0 to 6. It now runs in two common forms, each with limits.
One is transactional NPS: the question is asked in a specific context after a known interaction with a company, such as a service call or a purchase. You can't do that with other companies' customers, so there is no true benchmark against others. It is a useful internal diagnostic, but less helpful for understanding yourself versus others.
The other is relational NPS, which asks about the company as a whole, close to Reichheld's original construct. Custom relational studies, as commonly practiced, still have limits. Samples are modest, often in the thousands, and drawn from particular time periods. They typically survey a few head-to-head competitors, not the wider range of alternatives customers actually consider. They may omit related measures such as recency of use or perceived value. And results are hard to compare with standard benchmarks or to cut by audience, because sample sizes within any one audience are small.
Morning Consult's syndicated NPS is also relational. Through Morning Consult Intelligence (MCI) and what we call contextual NPS, it closes many of these gaps.
MCI puts NPS in context
In MCI, NPS sits beside value perception, buzz, consideration, usage, trust, favorability, community impact, and admired employer. The same questions apply to every brand, competitor set, country, or audience. The same dataset also captures economic sentiment, psychographics, media habits, political ideology, and shopper behaviors. Tracked over time and at scale, this per-person information turns NPS from an isolated number into one signal among several.
This lets us answer the three questions above. We use quick-service and fast-casual restaurants as a simple, familiar example.
Executive question 1: Where do we stand, and against whom?
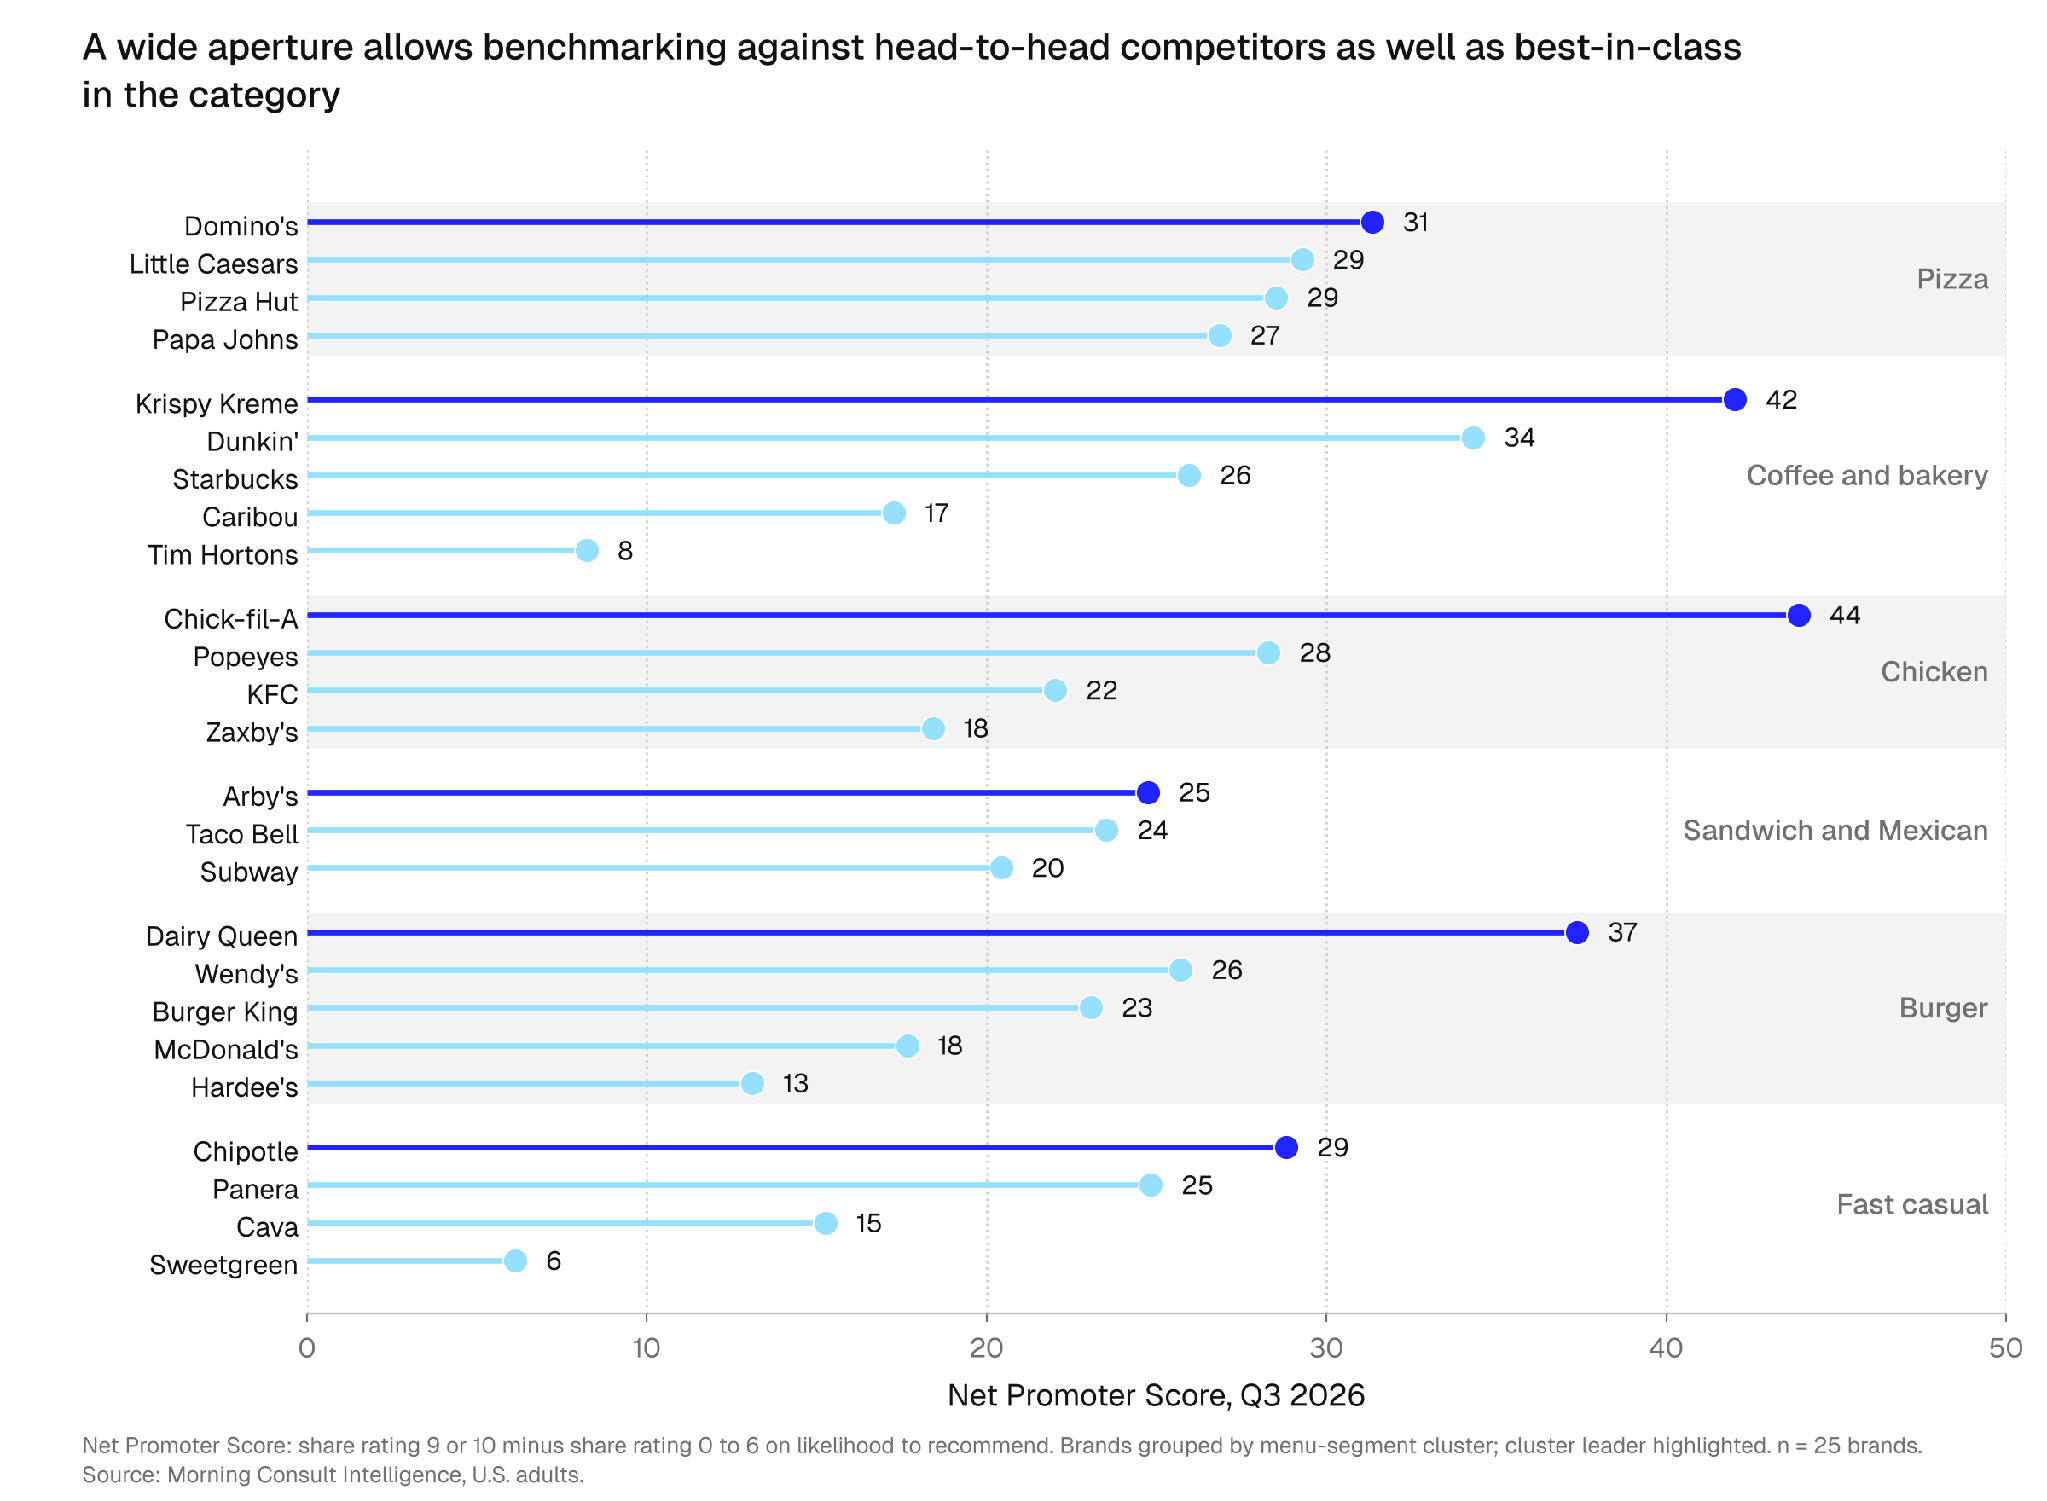
Across quick-service and fast-casual, an executive can benchmark against head-to-head competitors or against category leaders, and MCI supports either comparison with thousands of data points.
MCI also tracks these companies over time, often for several years, so we can see how a brand has trended, who is improving fastest, and how advocacy dynamics are shifting.
Executive question 2: Does advocacy connect to business outcomes?
First things first: control for structural differences
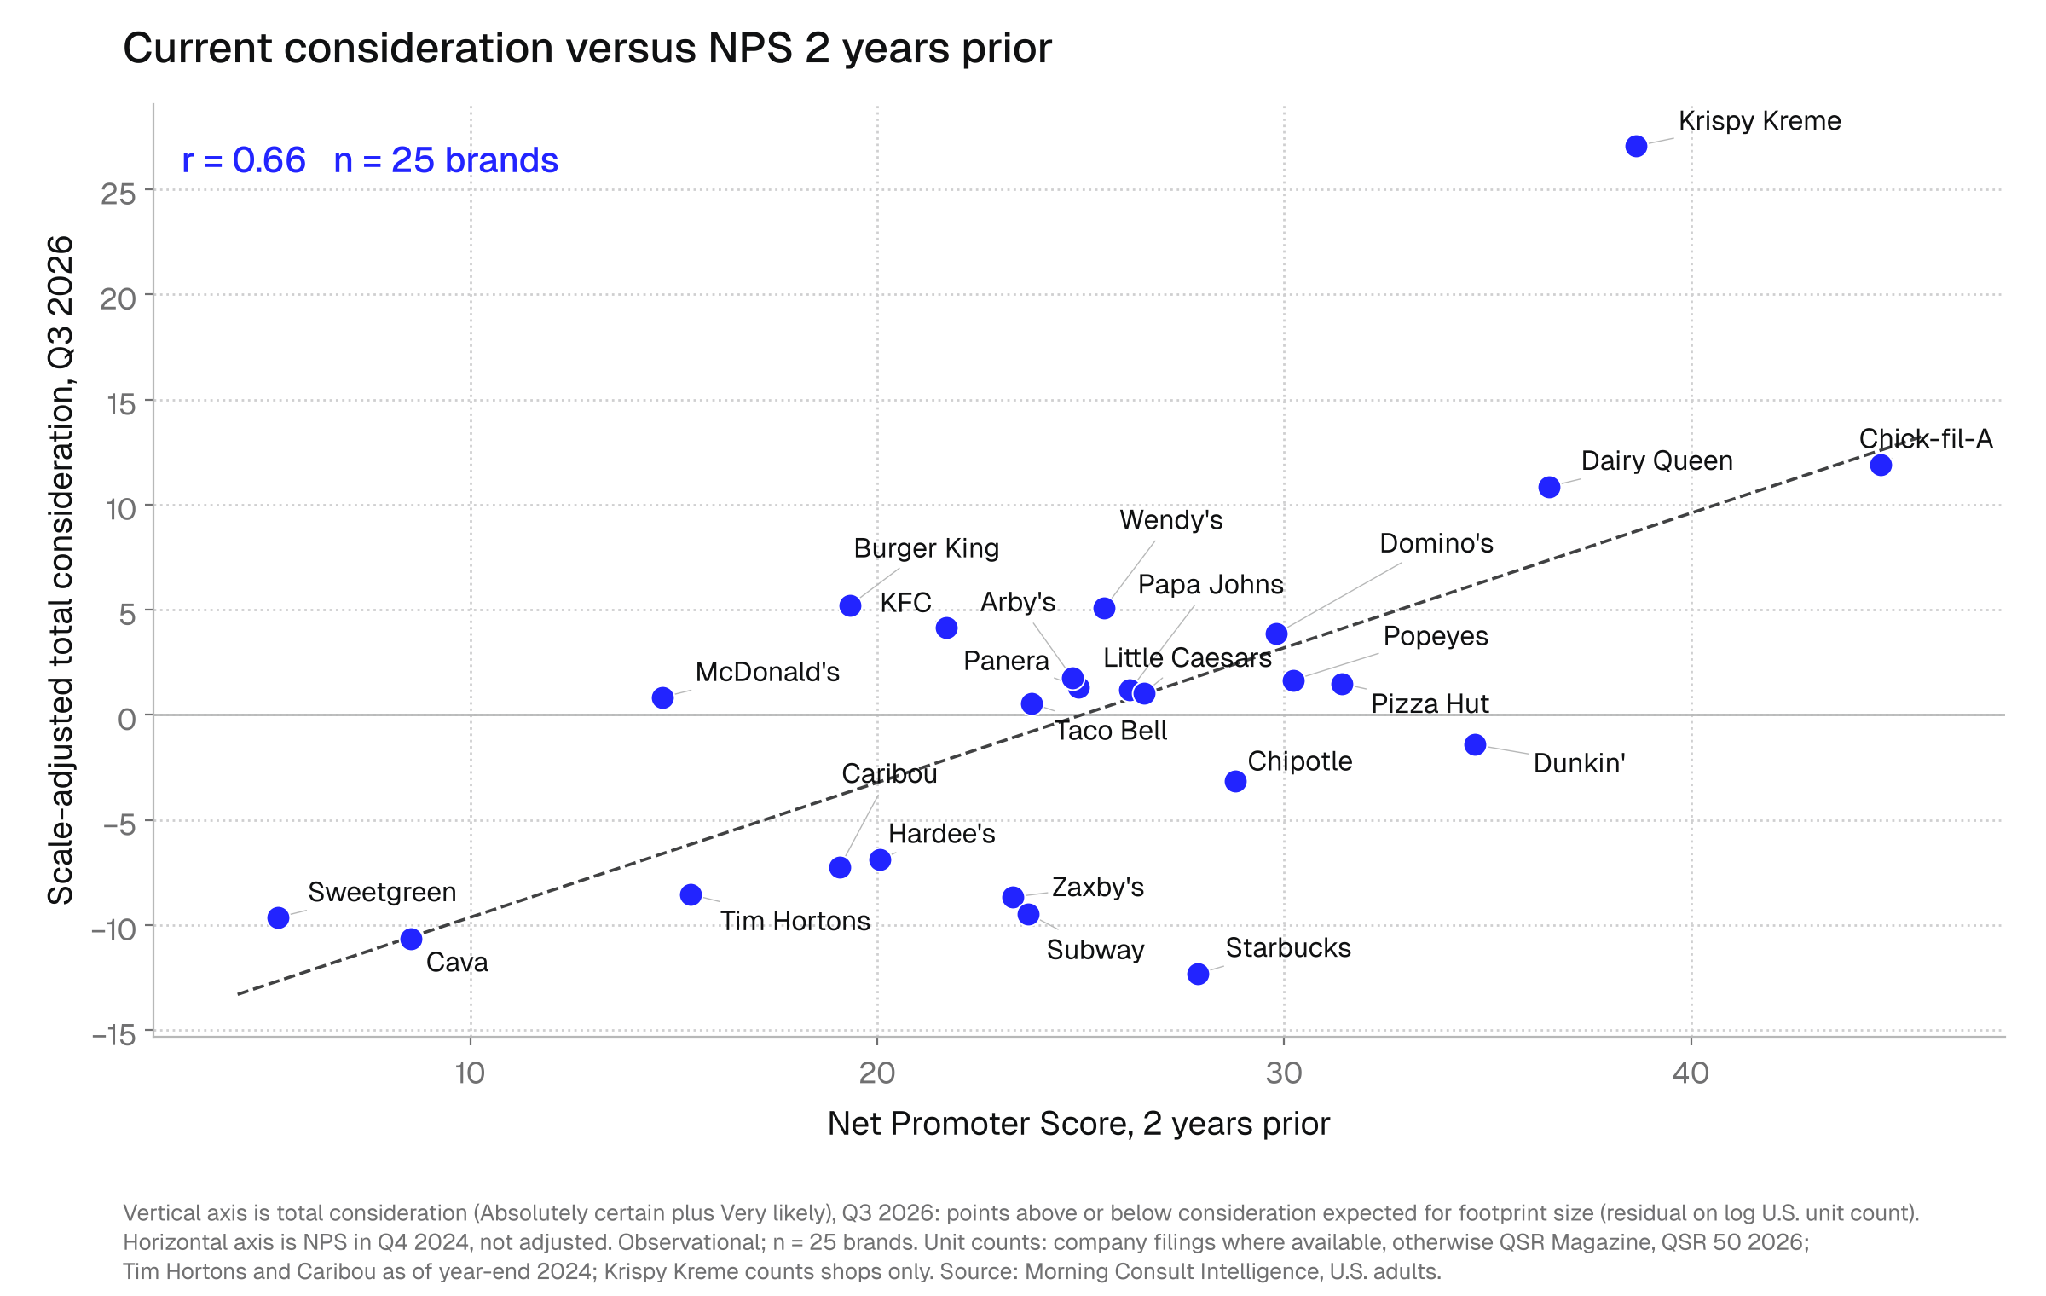
Structural factors such as distribution footprint can make scores incomparable, even between near head-to-head competitors. Large systems can win consideration and usage for reasons that have little to do with advocacy. Across the 25 brands, restaurant count alone explains more than half of the variation in consideration.
Adjust for scale, and the picture changes. For example, Krispy Kreme and Chick-fil-A both stand out dramatically relative to other quick service restaurants after the adjustment.
In other industries, such as consumer goods or subscription services, footprint may matter little or not at all. The discipline is to test whether it matters and adjust when it does. This is one of the analytical improvements built into our methods, and it shows why raw NPS scores should not be compared at face value. Context, here, industry structure, matters.
Does advocacy affect the business?
With peers chosen and adjustments made, we can turn to the real question: does advocacy relate to outcomes such as consideration, usage, and ultimately sales? Here we use consideration as the example.
There is a clear association. Brands with higher NPS in the fourth quarter of 2024 held higher consideration in the third quarter of 2026, even after controlling for scale. Advocacy carries through.
We would expect NPS and outcomes measured in the same period, from the same people, to be positively related. Here the respondents are different groups, nearly two years apart, which makes the link harder to dismiss as an artifact. Read in context, NPS is a usable signal of where a brand stands and how it may fare. This is an observational association, not proof of cause, but it makes NPS worth watching as a management signal.
Executive question 3: What can I do to improve?
Once NPS sits beside other measures, the focus shifts from where a brand's advocacy stands to what moves it.
Value, buzz, and other drivers provide context
Buzz and value sit next to NPS in the dataset, giving context for understanding NPS and how to influence it. In this category, buzz has a stronger relationship with NPS than value does, and poor value weighs on NPS more than good value lifts it.
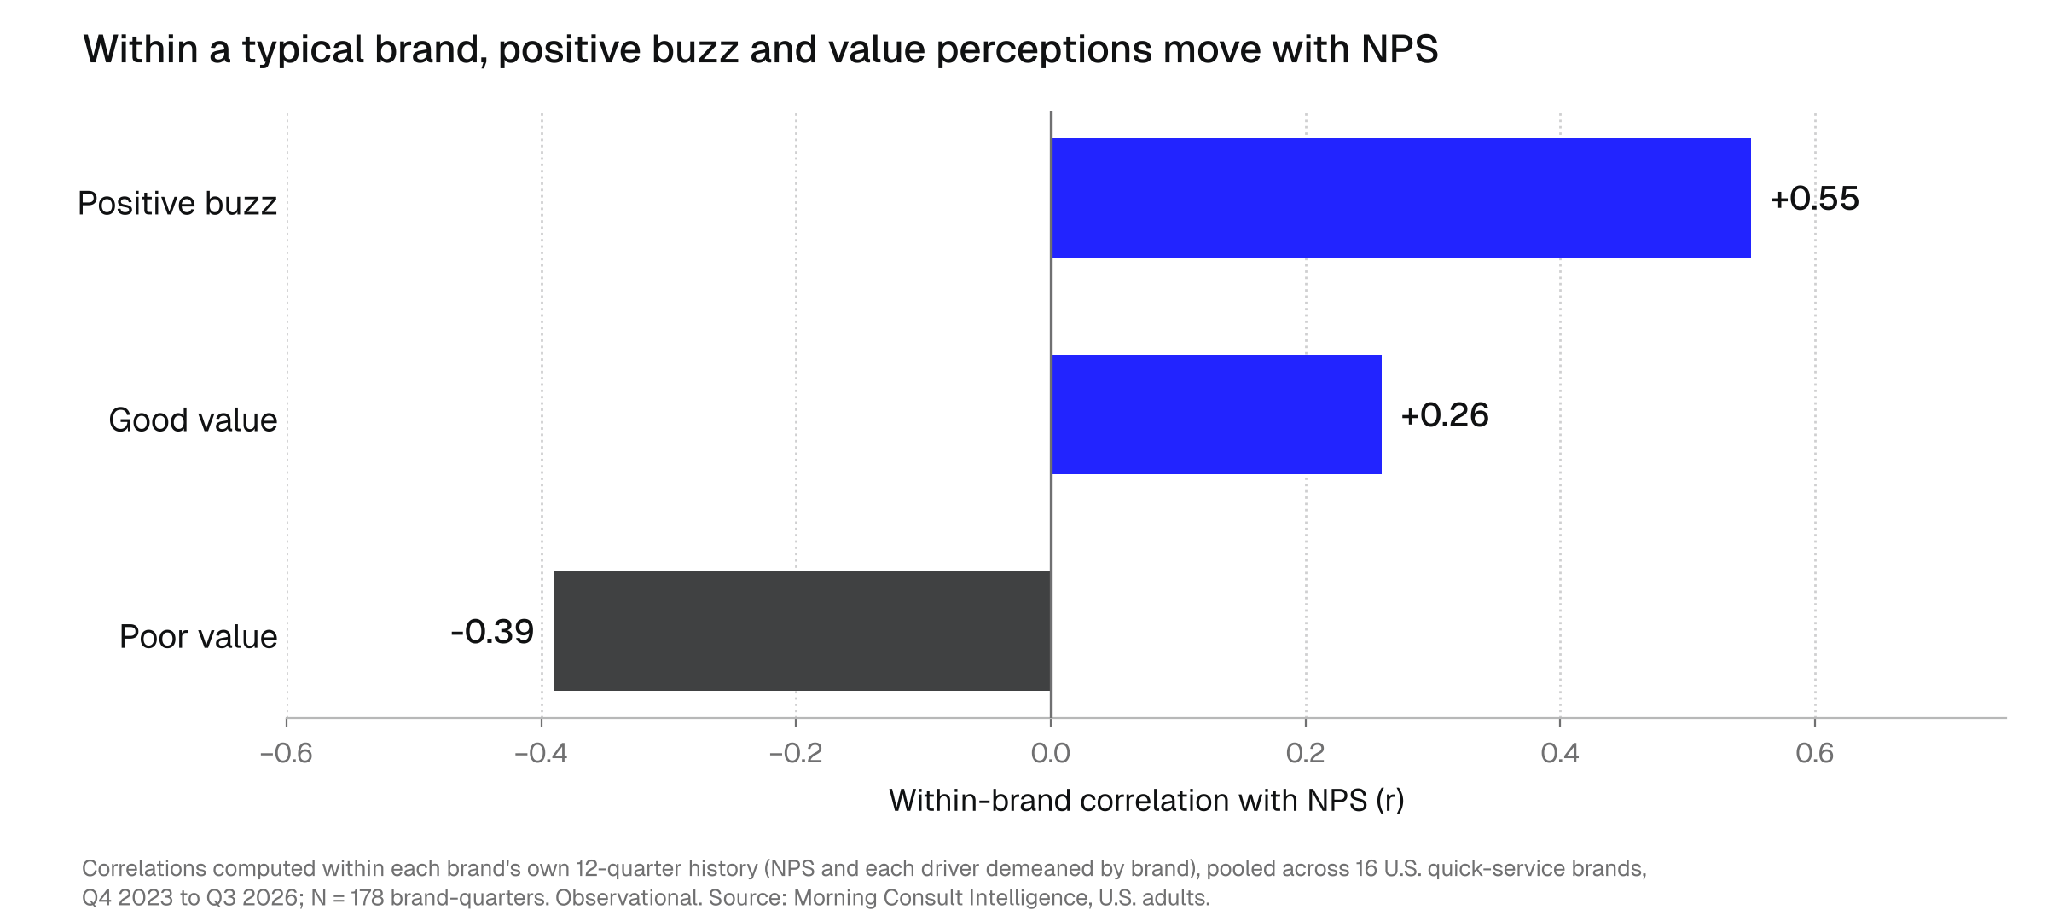
Drivers also help us judge whether an NPS change is lasting or transitory. A move without a corresponding change in buzz or value is more likely noise. A move that tracks buzz and value has an explanation and is more likely real. Context helps us weigh any single quarter of NPS.
Bringing it all together
Using NPS well means answering all three questions: where we stand and against whom, whether advocacy relates to outcomes, and what we can do to improve it.
The difficulty is that answering them takes extensive data and real adjustments, such as for distribution footprint and driver modeling. We have built this into MCI as a suite of tools that automate the analyses described here, apply best practices, and combine multiple measures across time series.
These tools and processes provide the context NPS needs to be meaningful.
Let's talk about how we can help
If you already use NPS, we can add context: comparisons across more companies, countries, and time periods. If you do not, we can add NPS as a relational, benchmarked view alongside the tools you use today to understand customer experience and advocacy, in a robust, scalable, and cost-effective way.
Sources
- T-Mobile (TMUS) Q1 2026 Earnings Call Transcript (https://www.fool.com/earnings/call-transcripts/2026/04/28/t-mobile-tmus-q1-2026-earnings-transcript/), The Motley Fool, April 28, 2026.
- The Dubious Management Fad Sweeping Corporate America (https://www.wsj.com/articles/the-dubious-management-fad-sweeping-corporate-america-11557932084), The Wall Street Journal, May 15, 2019.
- Delta Air Lines (DAL) Q4 2025 Earnings Call Transcript (https://finance.yahoo.com/quote/DAL/earnings/DAL-Q4-2025-earnings_call-396441.html), Yahoo Finance, January 13, 2026.

Cash App: The Youngest-Skewing Brand in the Payment Platforms Category

How the Hotel Category’s Spending Split Is Creating a Reputation Gap
